
Businesses generate data every day. Sales transactions, website visits, advertising results, customer interactions, inventory movements, accounting records, email campaigns, support requests, and other operational activities all create information that can potentially help a business intelligence (BI) system make better decisions.
The challenge is not usually a lack of data. The challenge is understanding what the data is telling you. A small business might have sales information in an e-commerce platform, advertising data in Meta Ads, customer information in a CRM, financial records in accounting software, website data in Google Analytics, and operational information in spreadsheets.
This is where business intelligence (BI) becomes useful. Business intelligence is a broad approach to collecting, preparing, analyzing, visualizing, and using business data to support better decisions. Modern BI platforms can connect multiple data sources, create interactive dashboards, produce reports, help users explore trends, and make important performance information easier to access.
But a BI tool is not automatically valuable simply because it has sophisticated charts, artificial intelligence, or hundreds of integrations. The right tool is the one that helps your business answer important questions with trustworthy data at a reasonable total cost and level of complexity.
This guide explains what business intelligence tools are, how they work, what they can do for small businesses, the difference between BI and business analytics, what features matter, how to evaluate popular platforms, and how to choose the right solution without paying for capabilities you do not need.
Written by Mukthar Salam
Last reviewed: October 2026
What Are Business Intelligence Tools?
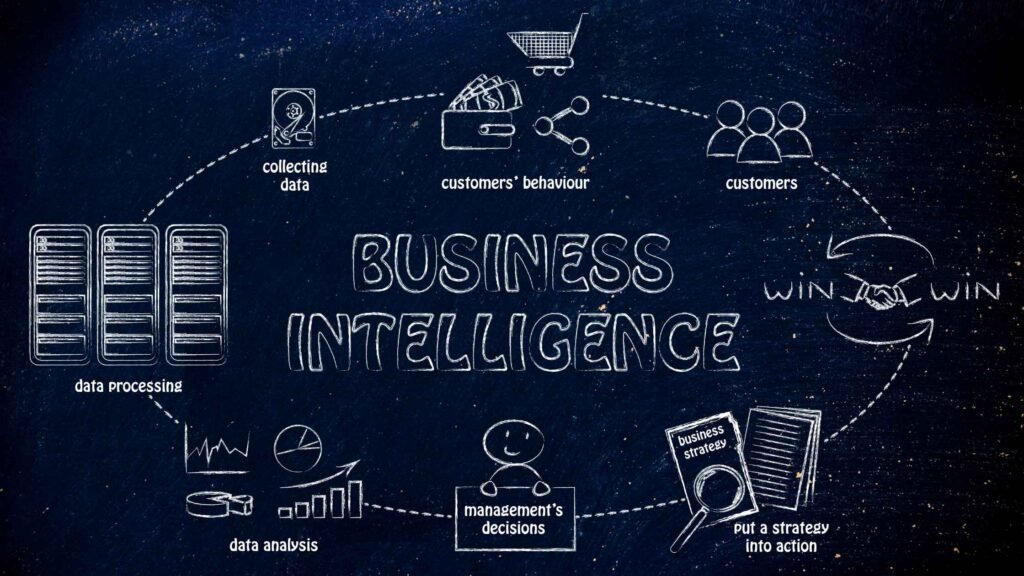
Business intelligence tools are software platforms that help organizations collect, combine, analyze, visualize, and communicate information from business data.
In simple terms: A BI tool helps turn business data into information that people can use to understand performance and make decisions.
A typical BI workflow might look like this: Data sources → Data preparation → Analysis → Visualization → Insight → Decision → Action.
For example: A company collects sales data from its e-commerce platform. The BI system combines that information with advertising and customer data.
The business then creates a dashboard showing:
- Revenue
- Orders
- Average order value
- Customer acquisition cost
- Conversion rate
- Product performance
- Marketing performance
Management can then investigate changes, identify patterns, and decide what action to take.
Microsoft describes this general BI process as collecting and transforming data, uncovering trends and inconsistencies, visualizing findings, and using the resulting insights to support action.
Business Intelligence Is More Than a Dashboard
One of the most common misconceptions about BI is that it simply means creating attractive charts. Dashboards are important, but they are only one component.
Modern BI can include:
- Data integration
- Preparation
- Modeling
- Reporting
- Querying
- Data visualization
- KPI monitoring
- Trend analysis
- Benchmarking
- Self-service analysis
- Forecasting
- Alerts
- Collaboration
- Data governance
- Security
- AI-assisted analytics
Tableau describes modern BI as an umbrella covering processes such as data preparation, data mining, reporting, querying, performance measurement, statistical analysis, and visualization.
This distinction matters because buying a dashboard product will not automatically solve a company’s data problems. If your underlying data is incomplete, inconsistent, duplicated, or incorrectly defined, a beautiful dashboard can simply make bad information look more convincing.
How Do Business Intelligence Tools Work?
Although BI platforms differ considerably, most follow a similar general process.
1. Connect to Data Sources
The first step is getting data into the BI environment. Common sources include:
- Spreadsheets
- Databases
- Accounting software
- CRM platforms
- Ecommerce systems
- Point-of-sale systems
- Advertising platforms
- Website analytics
- Marketing platforms
- Inventory systems
- Customer-support systems
For example, a retailer might connect: Shopify + Google Analytics + Meta Ads + accounting software. The purpose is to bring relevant information together so it can be analyzed in context.
2. Prepare and Clean the Data
Raw business data is rarely perfect. You may have:
- Duplicate customers
- Missing values
- Different date formats
- Inconsistent product names
- Different currencies
- Incorrect categories
- Duplicate transactions
- Inconsistent definitions
Data preparation helps address these problems before analysis. This stage is extremely important. Suppose one department defines “customer” as anyone who has created an account, while another defines a customer as someone who has completed a purchase.
A dashboard combining those figures could produce misleading conclusions even if every calculation is technically correct. Data definitions matter as much as data calculations.
3. Model the Data
Data modeling establishes relationships between different datasets.
For example, an e-commerce business might have:
- Customers: Customer ID
- Orders: Order ID, Customer ID, Product ID
- Products: Product ID, Category, Cost
Those relationships allow the business to answer more meaningful questions. For example:
- Which products generate the highest revenue?
- How much revenue does each customer generate?
- Which customer segments produce the highest average order value?
- Which products have high sales but low margins?
The complexity of this stage depends heavily on the organization’s data environment. A very small company using one spreadsheet may need little formal modeling. A larger organization with multiple databases may require sophisticated data architecture.
4. Analyze the Data
Once the data is prepared, the BI platform can be used to investigate it. Typical questions include:
- What happened?
- When did it happen?
- Which products performed best?
- Where did it happen?
- Which customer segments changed?
- Which marketing channels generated conversions?
- Where are costs increasing?
- Which locations are underperforming?
BI traditionally emphasizes understanding historical and current performance, although modern platforms increasingly incorporate predictive and AI-assisted capabilities.
5. Visualize the Results
The analysis can then be presented through:
- Charts
- Graphs
- Tables
- Scorecards
- Maps
- KPI cards
- Interactive dashboards
- Reports
Good visualization makes important information easier to understand.
For example, instead of reading thousands of sales records, a manager might see:
- Revenue: $250,000
- Monthly growth: +8%
- Conversion rate: 3.7%
- Average order value: $82
- Top product category: Electronics
The dashboard does not make the decision. It makes the relevant information easier to see.
6. Turn Insights Into Decisions
This is the step that matters most. A BI system has limited business value if people simply look at dashboards and do nothing.
Suppose the dashboard shows that:
- Product A has high sales but low margins.
- Product B has lower sales but much higher margins.
- One advertising channel generates many clicks but few profitable customers.
- Returning customers have significantly higher average order values.
Those findings could lead to decisions involving:
- Pricing
- Product promotion
- Advertising allocation
- Customer retention
- Inventory
- Sales strategy
The value comes from connecting information to action.
Business Intelligence vs. Business Analytics
These terms are often used interchangeably, but there is a useful distinction.
Business Intelligence
BI generally focuses on helping organizations understand business performance and make informed decisions from current and historical information.
Typical questions include:
- What happened?
- Where did it happen?
- How are we performing?
- Which KPIs are changing?
Business Analytics
Business analytics generally goes further into analytical methods designed to understand causes, predict outcomes, or identify potential actions.
Questions may include:
- Why did this happen?
- What is likely to happen next?
- What should we do?
Business analytics can include:
- Descriptive analytics
- Diagnostic analytics
- Predictive analytics
- Prescriptive analytics
These areas overlap with BI rather than existing as completely separate worlds. Tableau similarly explains BI as part of a broader data and analytics environment, with business analytics incorporating methods such as forecasting, predictive modeling, and statistical analysis.
For a small business owner, however, the terminology is less important than the practical objective: Use reliable data to answer important business questions.
Why Business Intelligence Matters for Small Businesses
BI is sometimes associated with large corporations, data warehouses, and teams of analysts. That is no longer the whole picture. Modern analytics platforms can support smaller organizations and individual departments as well.
However, small businesses should not assume that they need an expensive enterprise BI implementation. In many cases, the appropriate starting point may be a relatively simple reporting environment connected to a few important data sources.
The objective is not to build the most sophisticated data infrastructure possible. The objective is to solve a business problem.
What Can a Small Business Use BI For?

1. Sales Analysis
A sales dashboard can show:
- Revenue
- Orders
- Sales by product
- Sales by region
- Average order value
- Sales by salesperson
- Sales trends
- Repeat purchases
This can help management understand where revenue is coming from.
2. Marketing Performance
Marketing data can be difficult to interpret when it is spread across multiple platforms. A BI system can potentially combine information from:
- Google Ads
- Meta Ads
- Email marketing
- Website analytics
- CRM
- Ecommerce
This can help businesses compare:
- Traffic
- Leads
- Conversions
- Customer acquisition cost
- Revenue
- Return on advertising spend
However, businesses should be careful when combining attribution data from different platforms. Different platforms may use different attribution models and reporting windows. A dashboard should not create the illusion that attribution is perfectly precise.
3. Customer Analysis
BI can help businesses examine:
- Customer acquisition
- Repeat purchases
- Customer segments
- Purchase frequency
- Average customer value
- Retention
- Churn
- Product preferences
This can be particularly useful when customer information exists across multiple systems.
4. Financial Monitoring
Depending on the data sources and accounting setup, BI can help monitor:
- Revenue
- Expenses
- Gross margin
- Operating costs
- Cash-related metrics
- Budget versus actual performance
BI does not replace accounting software or professional accounting advice. Instead, it can provide another analytical layer over financial information.
5. Inventory and Operations
Retailers and product businesses can use analytics to monitor:
- Inventory levels
- Stock turnover
- Product demand
- Slow-moving inventory
- Supplier performance
- Sales trends
This can help businesses investigate operational problems before they become more expensive.
6. Performance Management
Managers can create KPI dashboards that track progress toward specific goals. For example:
Marketing
- Leads
- Cost per lead
- Conversion rate
Sales
- Revenue
- Gross margin
- Average order value
Customer service
- Response time
- Resolution time
- Customer satisfaction
Ecommerce
- Orders
- Conversion rate
- Cart abandonment
- Repeat purchases
The important principle is not to track everything. Track what supports a decision.
The Difference Between Metrics and KPIs
Another common problem is treating every metric as a KPI. They are not necessarily the same. A metric is a measurable quantity. A KPI is a measurement selected because it is important to a particular business objective.
For example:
A website might track:
- Page views
- Sessions
- Users
- Bounce rate
- Conversion rate
- Revenue
All are metrics. But if the business’s immediate goal is increasing online sales, the most important KPIs might include:
- Conversion rate
- Revenue
- Average order value
- Customer acquisition cost
The best BI dashboard therefore does not contain every available metric. It contains the metrics that help answer the business’s most important questions.
What Should You Look for in a Business Intelligence Tool?
Choosing BI software should begin with requirements—not product popularity. Here are the factors that matter most.
1. Data Sources and Integrations
Start by listing the systems you already use. For example:
- Google Analytics
- Meta Ads
- Shopify
- WooCommerce
- Salesforce
- HubSpot
- QuickBooks
- Xero
- Excel
- Google Sheets
- SQL databases
Then determine whether the BI platform can connect to those sources directly or through an appropriate connector. Do not assume that “hundreds of integrations” means the platform integrates well with your systems.
2. Data Quality
Ask:
- Who owns it?
- How often is it updated?
- How are errors handled?
- Where does the data come from?
- How are duplicate records managed?
- Are definitions consistent?
This is often more important than the number of chart types available.
3. Ease of Use
Consider who will actually use the platform. If the primary users are:
- Business owners
- Marketing managers
- Sales managers
- Operations teams
then a platform that requires extensive coding may create unnecessary friction. If you have experienced analysts or data engineers, more technically demanding software may be appropriate.
The right level of complexity depends on the people using the system.
4. Dashboards and Visualization
Look for dashboards that make important information easy to interpret. Consider whether the platform supports:
- Interactive filters
- Drill-downs
- KPI cards
- Charts
- Tables
- Maps
- Scheduled reporting
- Mobile access
- Sharing
But do not choose a platform solely because its dashboards look attractive. Visualization quality should support understanding rather than decoration.
5. Data Modeling
If you have multiple data sources, evaluate the platform’s ability to create reliable relationships between them.
This becomes increasingly important as the business grows. A simple reporting tool may be sufficient for one or two datasets. A larger organization may need stronger modeling capabilities and centralized governance.
6. Refresh Frequency
Ask how frequently your data needs to be updated. Possible requirements include:
- Daily
- Hourly
- Every few minutes
- Near real time
- On demand
A small business reviewing monthly sales may not need real-time analytics. A company monitoring inventory or operational events might have very different requirements. Do not pay for real-time infrastructure if your business decisions do not require it.
7. Security and Permissions
If sensitive information is involved, security becomes a core selection criterion. Consider:
- User roles
- Access controls
- Single sign-on
- Row-level security
- Data encryption
- Audit logs
- Data residency
- Compliance requirements
The more sensitive the data, the more carefully these capabilities should be evaluated.
8. AI Features
Many BI platforms now include AI-assisted functionality. These capabilities may help users:
- Ask questions using natural language
- Generate queries
- Identify patterns
- Explain anomalies
- Create visualizations
- Generate summaries
- Explore data conversationally
But AI does not eliminate the need for trustworthy underlying data. An AI-generated explanation is only as reliable as the data, definitions, permissions, and analytical logic behind it.
Treat AI as an analytical assistant—not as an unquestionable source of truth.
9. Collaboration
Consider how insights will be shared. Do you need:
- Scheduled reports?
- Email distribution?
- Shared dashboards?
- Mobile access?
- Microsoft Teams integration?
- Embedded analytics?
- Customer-facing dashboards?
Different businesses have different requirements.
10. Scalability
A tool should be able to grow with your requirements if you expect your analytics needs to increase. Consider:
- More data
- users
- dashboards
- data sources
- sophisticated models
- security requirements
However, scalability should not be confused with buying enterprise software on day one.
11. Total Cost of Ownership
Price is more than the monthly subscription. Consider:
- Software subscription
- Data connectors
- Implementation
- Data storage
- Training
- Administration
- Analyst time
- Maintenance
The cheapest license can become expensive if it requires extensive manual work. Likewise, the most expensive platform may be unnecessary for a small organization.
How to Choose the Right Business Intelligence Tool

The following seven-step process is more reliable than simply searching for “the best BI tool.”
Step 1: Define the Business Problem
Start with a business question.
For example: Why have online sales declined? Or: Which marketing channels produce profitable customers? Or: Which products should we prioritize? Avoid starting with: Which BI software should we buy?
The first question identifies the problem. The second jumps directly to the solution.
Step 2: Identify the Data Required
Once you know the question, identify the data required to answer it. For example:
Question
Which marketing channels generate profitable customers?
Required information
- Advertising spend
- Leads
- Customers
- Revenue
- Product costs
- Customer acquisition information
This exercise immediately eliminates many unnecessary tools.
Step 3: Audit Your Existing Data
Before buying software, examine your existing systems. Ask:
- Where is the data stored?
- Is it accurate?
- Are fields consistent?
- Are records duplicated?
- Can the systems be connected?
- Are there missing historical records?
You may discover that your biggest problem is not the absence of BI software. It is poor data organization.
Step 4: Select 3–5 Core KPIs
Do not begin with 50 KPIs. Choose a small number directly connected to your objective.
For example, a growing ecommerce business might begin with:
- Revenue
- Conversion rate
- Average order value
- Customer acquisition cost
- Gross margin
The exact KPIs should reflect the business model and objective.
Step 5: Shortlist Platforms
Now compare tools against your requirements.
Create a simple evaluation table:
| Requirement | Weight | Tool A | Tool B | Tool C |
| Required data connections | High | ✓ | ✓ | — |
| Ease of use | High | ✓ | — | ✓ |
| Dashboard capabilities | Medium | ✓ | ✓ | ✓ |
| Data modeling | High | ✓ | ✓ | — |
| Security | High | ✓ | ✓ | ✓ |
| Budget | High | ✓ | — | ✓ |
| Scalability | Medium | ✓ | ✓ | ✓ |
This approach is much better than choosing software because someone called it “the best.”
Step 6: Test With Real Business Data
Whenever possible, use a trial or proof-of-concept. Do not evaluate a BI platform only with a vendor’s sample dataset.
Connect a representative sample of your actual data. Try to answer three real business questions.
For example:
- Which products generate the highest gross margin?
- Which marketing channels produce the most sales?
- How has customer retention changed?
If the platform cannot answer those questions without excessive effort, reconsider whether it is appropriate.
Step 7: Measure Whether the Tool Is Actually Helping
After implementation, evaluate:
- Time saved
- Reporting accuracy
- Dashboard usage
- Decision speed
- Manual work reduced
- Business questions answered
- Errors identified
The objective is not to own BI software. The objective is to improve the way the business uses information.
10 Business Intelligence Platforms to Consider in 2026
Rather than calling these the “10 best” BI tools, it is more useful to understand what each platform is designed to do and where it may fit.
No single product is automatically the right choice for every organization.
1. Microsoft Power BI
Microsoft Power BI is a business intelligence and data visualization platform designed for creating interactive reports, dashboards, and analytics. It is particularly relevant to organizations already using Microsoft technologies.
Microsoft describes Power BI as a platform that can connect data, analyze it, create visualizations, and support decision-making.
Notable characteristics
- Interactive reports
- Dashboards
- Data visualization
- Data modeling
- Integration with Microsoft products
- AI-assisted capabilities
- Power BI Desktop
- Cloud-based sharing
Pricing
Microsoft currently lists:
- Free account
- Power BI Pro
- Power BI Premium Per User
The U.S. pricing page currently lists Power BI Pro at $14 per user/month when paid yearly and Premium Per User at $24 per user/month when paid yearly, excluding tax. Pricing and licensing can vary by region and purchasing arrangement.
Consider Power BI if:
- You already use Microsoft 365
- Excel is central to your workflow
- You need strong reporting and modeling
- Your organization expects to scale analytics
Potential consideration
Power BI can become technically sophisticated. Organizations should account for training and data-modeling requirements rather than assuming that installing the software is enough.
2. Tableau
Tableau is a visual analytics platform focused heavily on interactive data exploration and visualization. Its BI capabilities include data preparation, analysis, dashboards, reporting, and sharing.
Notable characteristics
- Interactive visualization
- Dashboards
- Data exploration
- Reporting
- Data preparation
- Collaboration
- AI-assisted analytics
Pricing
Tableau’s current pricing page lists Tableau Standard from $15 per user/month and Tableau Enterprise from $35 per user/month, billed annually, for the listed Cloud offerings. Actual costs depend on edition, deployment, users, and requirements.
Consider Tableau if:
- Visualization is a major priority
- Your team needs interactive analysis
- You want a mature analytics environment
Potential consideration
The platform can require more training and budget than simpler reporting tools.
3. Google Looker Studio
Google Looker Studio is a reporting and visualization platform that can be particularly useful for organizations already working extensively with Google’s data ecosystem. It can be used to create dashboards and reports from connected data sources.
Consider it when:
- Your business uses Google Analytics
- Google Ads is central to reporting
- You work heavily with Google Sheets
- You need accessible reporting dashboards
Potential consideration
The suitability of Looker Studio depends heavily on the complexity of your data environment and the connectors required. It should not automatically be treated as a complete replacement for a more comprehensive enterprise BI architecture.
4. Zoho Analytics
Zoho Analytics is a BI and analytics platform designed to connect business data and create reports and dashboards. Zoho’s 2026 product updates show continued expansion of its data connectors and analytics capabilities.
Zoho’s current pricing documentation lists an Always Free plan and paid plans beginning at $25/month for the stated configuration, although pricing and limits should be checked directly before purchase.
Consider it when:
- You already use Zoho products
- And you need a broad range of business integrations
- You want reporting without building a large analytics department
5. Sisense
Sisense is an analytics platform with capabilities for building, embedding, and integrating analytics into applications and workflows. Its official documentation covers data connections, modeling, dashboards, AI-powered analytics, and embedded analytics.
Consider it when:
- Embedded analytics is important
- You are building analytics into a product
- Your organization has more advanced analytics requirements
Potential consideration
Sisense is generally more relevant to organizations with sophisticated analytics or embedded-analytics requirements than to someone who simply needs a basic marketing dashboard.
6. Domo
Domo is a cloud-based business intelligence and data platform focused on bringing data together and making it accessible through dashboards and analytics.
It may be relevant to organizations that need:
- Business dashboards
- Data integration
- Collaboration
- Broad organizational reporting
Pricing should be evaluated directly with the vendor because enterprise analytics pricing can depend substantially on users, data, features, and implementation requirements.
7. Qlik Sense
Qlik Sense is an analytics platform built around interactive exploration and visualization. Its current documentation describes Qlik Cloud Analytics as supporting analytics workloads and combining capabilities involving AI, predictive analytics, Qlik Sense, and other BI assets.
Qlik Sense also supports interactive visualizations, dashboards, filters, and exploratory analysis.
Consider it when:
- Your users need interactive exploration
- You have complex data relationships
- You need self-service analytics
- Your organization expects broader analytics requirements
8. Metabase
Metabase takes a somewhat different approach.
It is designed to make data exploration and business intelligence accessible to organizations, including teams that want SQL capabilities or open-source deployment options. Its current offering includes an open-source option as well as managed paid plans.
Notable characteristics
- Dashboards
- SQL querying
- Self-service exploration
- Open-source deployment
- Cloud deployment
- AI-assisted querying
- Embedding
Metabase currently lists its open-source edition as free, while its Starter cloud plan is listed at $100/month before additional user charges under its current pricing structure.
Consider it when:
- You have technical staff
- SQL is part of your workflow
- You value open-source flexibility
- You need straightforward internal analytics
9. SAP BusinessObjects
SAP BusinessObjects is an enterprise-oriented business intelligence environment. It is more appropriate to evaluate in the context of larger organizations, established SAP environments, complex reporting requirements, and formal enterprise data governance.
For a very small business that needs a basic sales dashboard, an enterprise platform of this nature may introduce unnecessary complexity.
10. MicroStrategy
MicroStrategy is an enterprise analytics platform focused on large-scale analytics, reporting, and organizational data use.
It is better evaluated by organizations with substantial analytics requirements rather than automatically recommended to small businesses simply because it offers advanced functionality.
Business Intelligence Tool Comparison
| Platform | Strong Fit | Complexity | Typical Use |
| Power BI | Microsoft-oriented organizations | Medium–High | Reporting, dashboards, modeling |
| Tableau | Visualization-heavy teams | Medium–High | Interactive analytics |
| Looker Studio | Google-oriented teams | Low–Medium | Marketing and reporting |
| Zoho Analytics | Small/mid-sized businesses | Low–Medium | Business reporting |
| Sisense | Embedded analytics | High | Product and enterprise analytics |
| Domo | Broad business analytics | Medium–High | Organizational dashboards |
| Qlik Sense | Exploratory analytics | Medium–High | Data discovery |
| Metabase | Technical/self-service teams | Low–Medium | SQL and internal analytics |
| SAP BusinessObjects | Enterprise environments | High | Enterprise reporting |
| MicroStrategy | Large organizations | High | Enterprise analytics |
Important: This table is a functional comparison, not a ranking. The appropriate platform depends on your data environment, users, budget, security requirements, and business questions.
Do Small Businesses Need a Business Intelligence Tool?
Not necessarily. This is an important point that many software articles overlook. If your business has:
- One simple data source
- A small number of transactions
- Limited reporting requirements
- Straightforward KPIs
then a well-structured spreadsheet may be enough. You may not need a dedicated BI platform yet. A BI platform becomes more compelling when:
- Data is spread across multiple systems
- Manual reporting consumes significant time
- Managers need recurring dashboards
- Data volume is increasing
- Different teams need consistent metrics
- You need more advanced analysis
- Manual spreadsheet consolidation is becoming unreliable
The right technology is the one that solves the current problem without creating unnecessary complexity.
When Should You Move Beyond Spreadsheets?
Spreadsheets remain useful. They are flexible, inexpensive, and familiar. But problems can arise when teams repeatedly:
- Copy and paste data
- Maintain multiple versions
- Manually merge reports
- Rebuild the same dashboard
- Email files between departments
- Correct inconsistent formulas
- Spend hours preparing recurring reports
A BI platform can automate some of that workflow. The transition should happen because manual reporting has become a business problem—not because BI software sounds more sophisticated.
Common Business Intelligence Mistakes
1. Buying Software Before Defining the Problem
This is probably the biggest mistake.
Do not start with: Which BI platform should we buy?
Start with: Which business decision are we struggling to make?
2. Tracking Too Many KPIs
A dashboard containing 80 metrics can be less useful than one containing five meaningful KPIs. More information does not automatically produce better decisions.
3. Ignoring Data Quality
If the source data is wrong, the dashboard can be wrong. Always establish clear definitions and data-quality processes.
4. Assuming Real-Time Data Is Always Better
Real-time information is useful for certain operational situations. But not every decision requires second-by-second updates.
For strategic reporting, hourly, daily, weekly, or monthly updates may be entirely appropriate. Match refresh frequency to the decision.
5. Treating AI Insights as Automatically Correct
AI can help identify patterns, generate queries, summarize results, and accelerate analysis.
But AI-generated conclusions should still be validated. Important business decisions should not depend entirely on an unexplained automated recommendation.
6. Ignoring User Adoption
A technically excellent BI system can fail if employees do not use it. The implementation therefore needs:
- Training
- Documentation
- Clear ownership
- Defined KPIs
- Consistent terminology
- Management support
7. Measuring Vanity Metrics
Some metrics look impressive but have limited decision-making value.
For example:
- A website may have millions of page views but poor profitability.
- A marketing campaign may produce thousands of clicks but very few profitable customers.
- The goal is not to maximize impressive numbers.
- The goal is to measure what matters to the business.
8. Assuming BI Automatically Produces Profit
BI does not create profitability by itself. It improves access to information. Management still has to:
- Interpret the information
- Make decisions
- Execute changes
- Test results
- Learn from outcomes
The technology supports the process. It does not replace management.
A Simple BI Implementation Plan for a Small Business

You do not need to build a massive analytics system immediately. Use a phased approach.
Phase 1: Define
Choose:
- One business problem
- Three to five KPIs
- The required data sources
Phase 2: Clean
Review:
- Data accuracy
- Duplicate records
- Missing values
- Naming conventions
- Dates
- Currency
- Customer identifiers
Phase 3: Connect
Connect the most important data source first. Do not connect everything simply because the platform allows it.
Phase 4: Build
Create one dashboard containing:
- Core KPIs
- One or two trend charts
- Important breakdowns
- Filters needed for investigation
Phase 5: Use
Review the dashboard according to the decision cycle. For example:
Weekly marketing review: Analyze performance, identify changes, decide what to adjust, implement changes, review results.
Phase 6: Expand
Only after the first system works should you add:
- Additional data sources
- More dashboards
- Advanced analytics
- Predictive models
- AI features
- Automated alerts
This prevents the project from becoming unnecessarily complicated.
Questions to Ask Before Buying a BI Tool
Before signing a contract, answer these questions.
About your data
- How many systems need to be connected?
- How large are our datasets?
- Where is our data stored?
- How clean is our data?
About users
- Who will use the platform?
- Do they know SQL?
- Do they need self-service analytics?
- How many users need access?
About reporting
- Which KPIs matter most?
- How frequently does data need to refresh?
- Do we need scheduled reports?
- Do we need mobile access?
About security
- Does the platform meet our security requirements?
- Do we need role-based access?
- Is row-level security required?
- Are there regulatory or data-residency requirements?
About cost
- What is the license cost?
- What will implementation cost?
- Are connectors charged separately?
- Will administration require technical staff?
About growth
- Will the platform handle more data?
- Will it support more users?
- Can we add additional sources?
- Can it support our future reporting requirements?
If you cannot answer these questions, you probably are not ready to select a BI platform.
Frequently Asked Questions
What are business intelligence tools?
Business intelligence tools are software platforms used to collect, integrate, analyze, visualize, and communicate business data so organizations can make more informed decisions. They can include dashboards, reports, data modeling, visualization, querying, analytics, alerts, and other capabilities.
What is an example of a business intelligence tool?
Examples include:
- Microsoft Power BI
- Tableau
- Google Looker Studio
- Zoho Analytics
- Qlik Sense
- Metabase
- Sisense
- Domo
- SAP BusinessObjects
- MicroStrategy
The appropriate choice depends on the organization’s requirements.
What is the difference between BI and analytics?
Business intelligence is a broad discipline involving the collection, preparation, analysis, visualization, and communication of business information.
Analytics is often used to describe the analytical methods applied to that information, including descriptive, diagnostic, predictive, and prescriptive approaches. The terms overlap considerably, and vendors may use them differently.
Is Excel a business intelligence tool?
Excel is primarily a spreadsheet application, but it can perform many analytical and reporting functions associated with BI. For example, businesses can use Excel for:
- Data analysis
- Pivot tables
- Charts
- Forecasting
- Reporting
- Data transformation
However, a dedicated BI platform may be more appropriate when an organization needs centralized dashboards, automated reporting, multiple data connections, governance, or broader self-service analytics.
Is SQL a business intelligence tool?
No. SQL is a programming/query language used to interact with relational databases. It is commonly used alongside BI platforms to retrieve and analyze data.
Some BI tools allow users to work with SQL directly, while others provide visual interfaces that reduce the need for SQL.
Are business intelligence tools only for large companies?
No. Small businesses can use BI tools when they have a genuine need for consolidated reporting and analysis.
However, not every small business needs dedicated BI software. A spreadsheet or reporting tool may be sufficient for a small operation with limited data complexity.
Are business intelligence tools expensive?
They range from free or low-cost options to sophisticated enterprise platforms with substantial licensing and implementation costs.
For example, Microsoft’s current Power BI pricing includes a free account and paid per-user plans, while Metabase offers an open-source edition and paid cloud options. The license price should not be the only consideration. Evaluate total cost, including implementation, training, administration, connectors, and data infrastructure.
Do BI tools use artificial intelligence?
Many modern BI platforms now incorporate AI capabilities. Depending on the platform, these may include:
- Natural-language queries
- Automated insights
- Anomaly detection
- Forecasting
- Query generation
- AI assistants
- Automated summaries
However, AI features should be evaluated alongside data quality, governance, security, and explainability. You can explore more on using AI for your business intelligence systems.
What is the best BI tool for a small business?
There is no universal best choice. The appropriate platform depends on:
- Business objectives
- Data sources
- Budget
- Technical expertise
- Number of users
- Security requirements
- Reporting needs
- Scalability requirements
A small business using Microsoft products may have very different requirements from a Google-focused marketing agency or a software company embedding analytics into its product.
How many KPIs should a BI dashboard have?
There is no universal number. However, starting with approximately three to five critical KPIs can help keep an initial dashboard focused. Add metrics only when they contribute to an actual business question or decision.
Final Takeaway
Business intelligence is not about creating the most impressive dashboard. It is about creating a reliable connection between business data and business decisions. A well-designed BI system can help a company understand sales performance, monitor marketing activity, analyze customers, investigate operational problems, track KPIs, and identify changes that deserve attention.
But the software itself is not the strategy. The most important work happens before and after the dashboard is created: Define the question → Identify the data → Clean the data → Connect the sources → Build useful metrics → Analyze the results → Take action → Measure the outcome.
When choosing a BI platform, resist the temptation to buy the tool with the longest feature list. Instead, evaluate the platform against your actual requirements.
Platforms such as Power BI, Tableau, Looker Studio, Zoho Analytics, Qlik Sense, Metabase, Sisense, Domo, SAP BusinessObjects, and MicroStrategy all occupy different positions in the analytics landscape. Current product capabilities and pricing also continue to change, so buyers should verify specifications directly with the vendor before making a purchasing decision.
For a small business, the smartest starting point may be surprisingly simple. Choose one important business problem, identify three to five meaningful KPIs, connect the most important data source, and build a dashboard that helps someone make a real decision.
Then expand from there. That is how business intelligence becomes more than another piece of software. It becomes part of the way the business learns, operates, and makes decisions.
About the Author
Mukthar Salam
He is the founder and author of MarketLiftAI. Mukthar is passionate about Business and Technology, since 2023 he has written over 100 articles covering AI Tools, Business Software, SaaS Platforms, Internet Services, Cybersecurity, Digital Marketing, Cloud Computing, Business Finance Tools and Online Business Services. Over the past 3 years. Mukthar has been building, analyzing, and Maintaining Websites for over 3 years and also shares his wealth of knowledge and experience on MarketLiftAI.